
New Visualization Apps on OSDR
The Open Science Data Repository (OSDR) team has been hard at work this year developing new visualization apps to provide
additional information for your research and analysis needs using data from the OSDR. Read below for more information about the
two latest apps.
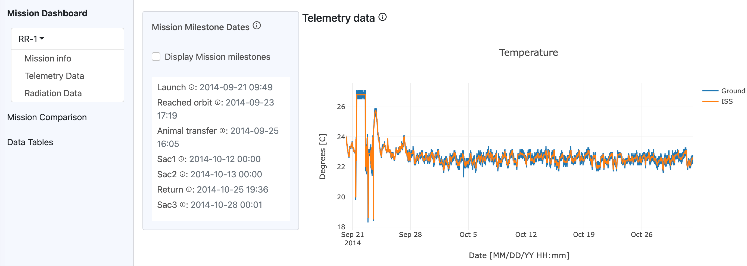
Environmental Data Application
The Environmental Data Application provides the capability to visualize telemetry and radiation data collected on the
International Space Station and corresponding ground platforms during the Rodent Research missions. Telemetry data includes
temperature, relative humidity, and CO2 levels. Radiation data includes galactic cosmic rays, South Atlantic Anomaly, accumulated
radiation dose, and total radiation dose. The application allows users to view single missions, compare two missions, and view and
download summary or full data tables. So, come check out the new
Environmental Data Application
now!
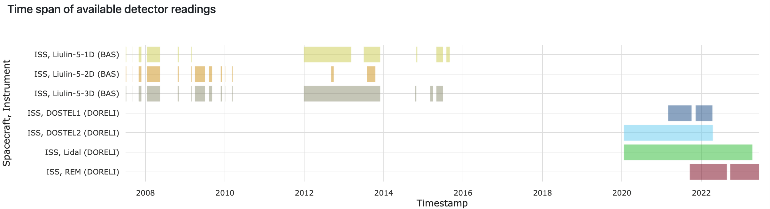
RadLab Portal and RadLab Data API
The RadLab Portal provides access to radiation telemetry data from multiple databases maintained by multiple space agencies. The
Web interface provides the ability to query, visualize, inspect, and download data; for example, time series plots of readings
from multiple radiation detectors, pairwise comparisons of detector readings, and geospatial visualizations of radiation dose and
flux registered by the detectors. The demo version of RadLab contains the data obtained from four detectors included in the DORELI
project (DOSTEL1, DOSTEL2, Lidal, REM, Italian Space Agency) and the data from three Liulin-5 detectors (Bulgarian Academy of
Sciences). All seven detectors are/were located on the International Space Station (ISS). The RadLab Data API enables data
selection and retrieval at a programmatic level. Take a moment to explore the
RadLab Portal and Data API
now!


